After a while of inactivity on this website, I have decided to revive this. Production value of some things may increase as I have a better and newer laptop than before and have discovered some more things to help me produce more. I have been posting some less formal, sometimes focused things on my Twitter. Thank you to the small amount of people here who support me and what I do.
Author: Sequelaen
GitHub
I’ve created a GitHub account and code repository for some of my works.
How My Images Are Made (and More)
1 – Find Content
In order to know what to make, I go around the internet searching for math and cool chaos-theory related stuff. These are not very easily found, however some simple online searches won’t hurt. I have learned content from many websites, but most significantly Paul Bourke’s Website and Softology’s Blog (Full list is on the home page in “Credit”.)
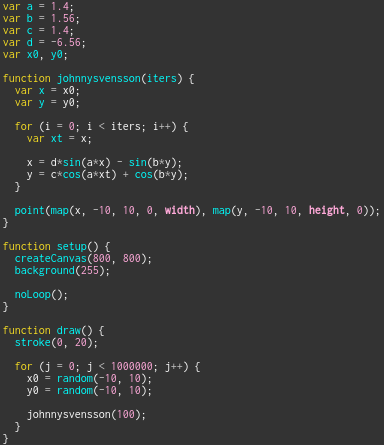
2 – Code
After content is found, I implement it into p5.js. It is created on an 800 by 800 sized canvas for details. I use a function to express the equations and iterate, and the draw() function to render the actual image. This usually involves lots of points, which is why the stroke opacity is very low. This creates a relatively noise-less image depending on how long you want to wait (it can take a while.) When the final image is produced, we can move on to the next step.
3 – Blog It
After the image is done, it is copy and pasted into a new block (or post, somewhat.) The basic information is written and I use LaTeX to get quality equations.
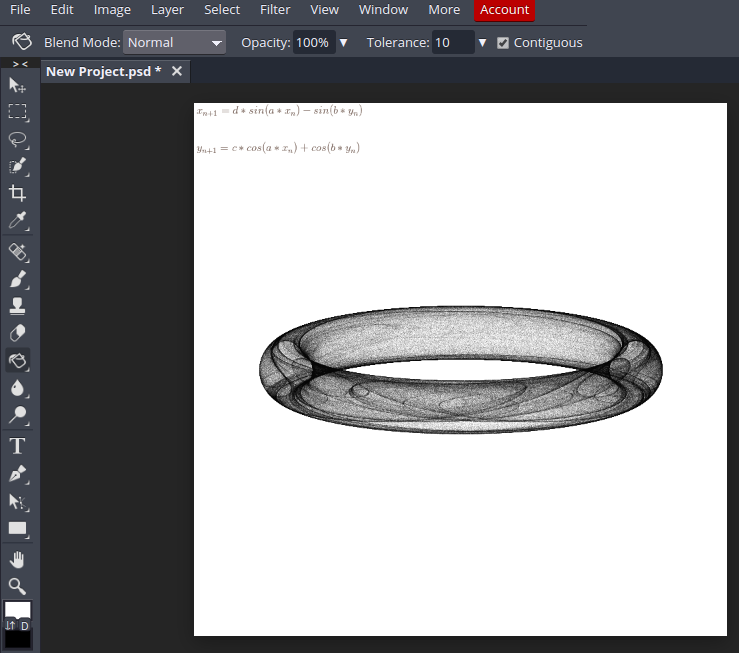
4 – Edit
I post most of these on Reddit, and to do that I have to include information about the image. I open the blog page and copy snapshots of the LaTeX equations. I edit them onto the image using a free online software called Photopea. Once the editing is done I can post it to Reddit.
Testing GIFs
Credit
Often I find information from other websites, code them, and then explain them in my own words. So, credit goes to these websites (listed by significance):
Information
This website is a collection of my Mathematical creations in p5.js, u/Sequelaen.
If you plan on using one of my images commercially in any form (including social media), please do credit me (u/Sequelaen).
